
Summary
In the ECB’s Survey of Professional Forecasters (SPF) for the third quarter of 2023, expectations for headline HICP inflation were broadly unchanged compared to the previous survey (conducted in the second quarter).[1] However, these unchanged aggregate expectations concealed downward revision to HICP energy and food and upward revisions to expectations for HICP inflation excluding energy and food (HICPX). The latter reportedly reflecting recent data outturns showing more persistence than expected as well as higher forecast wage growth. Headline inflation was expected to decline from 5.5% in 2023 to 2.7% in 2024 and 2.2% in 2025. Longer-term HICP inflation expectations (for 2028 in this survey round and for 2027 in the previous survey) were unchanged at 2.1%. Uncertainty surrounding longer-term inflation expectations remained at elevated levels, while the balance of risks remained broadly neutral. Real GDP growth expectations were unchanged for 2023 but slightly down for 2024 and 2025. There was also a downward tilt in the balance of risks. The short-term GDP outlook implied a modest but constant increase in economic activity over the period from the second quarter of 2023 to the first quarter of 2024. Longer-term GDP growth expectations were revised down slightly to 1.3%. Unemployment expectations were around 6.6-6.7% for 2023 to 2025 but declined to 6.5% for 2028.
Table 1
Results of the SPF in comparison with other expectations and projections
(annual percentage changes, unless otherwise indicated)

1) Longer-term expectations refer to 2028. In the ECB SPF round in the second quarter of 2023 they referred to 2027.
2) As a percentage of the labour force.
1 Limited revisions to HICP inflation expectations for 2023-25
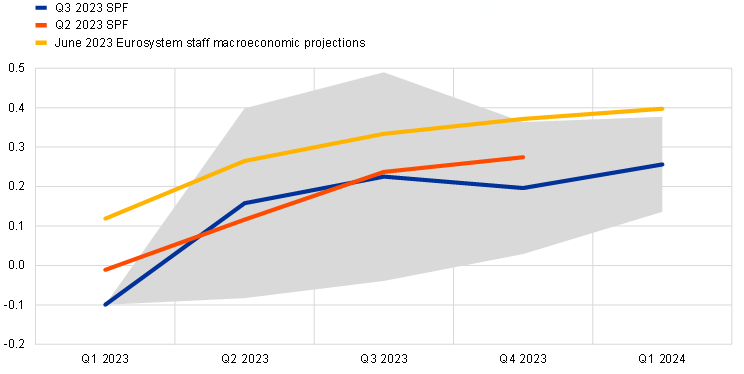
SPF respondents made limited revisions to their HICP inflation expectations for 2023 and 2024. Inflation expectations for 2023 were revised downward by 0.1 percentage points to 5.5%, while those for 2024 were revised upward by 0.1 percentage points to 2.7%. Those for 2025 were unchanged at 2.2% (see Chart 1). Compared with the June 2023 Eurosystem staff macroeconomic projections for the euro area, which were based on May 2023 HICP data as the latest available information, inflation expectations in this SPF round were 0.1 percentage points higher for 2023, and 0.3 percentage points lower for 2024 and 2025 (see Table 1).
Chart 1
Inflation expectations: overall HICP inflation and HICP inflation excluding energy and food
(annual percentage changes)
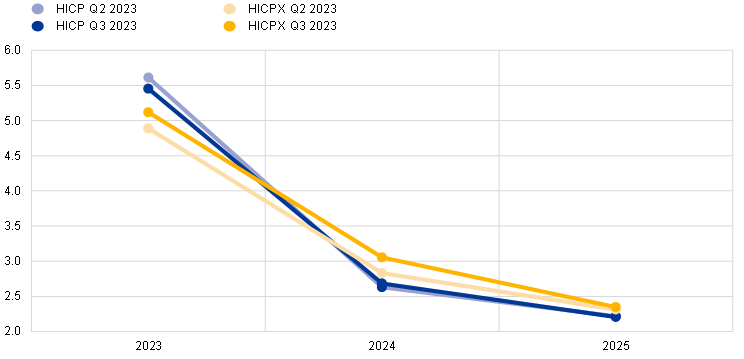
Regarding the nearer-term outlook, respondents emphasised lower energy prices and lower food price inflation. Taken together, the information on HICP and HICPX expectations suggests that SPF respondents have revised downward significantly their expectations for the sum of HICP energy and food for 2023 (and, to a lesser extent, also for 2024 and 2025).
SPF expectations for inflation excluding energy and food were revised up for 2023 and 2024. HICPX expectations for 2023, 2024 and 2025 stood at 5.1%, 3.1% and 2.3% respectively – representing upward revisions of 0.2 percentage points for 2023 and 0.3 percentage points for 2024 but no change for 2025. Respondents indicated that the upward revisions reflected recent data outturns showing more persistence than expected as well as higher forecast wage growth. Regarding labour costs, respondents cited the mix of elevated inflation and labour market tightness as the main influencing factors. At a more disaggregated level, for (non-energy, non-food) goods, respondents noted a number of factors indicating some moderation of consumer inflation. These factors were easing supply pressures, the abating of indirect effects from past energy price hikes and declines in some non-labour input costs. On the other hand, they considered that wage pressures would exert inflationary pressure on services. The upward revisions to the SPF forecasts for HICPX brought them closer in line with those from the June 2023 Eurosystem staff macroeconomic projections (see Table 1).
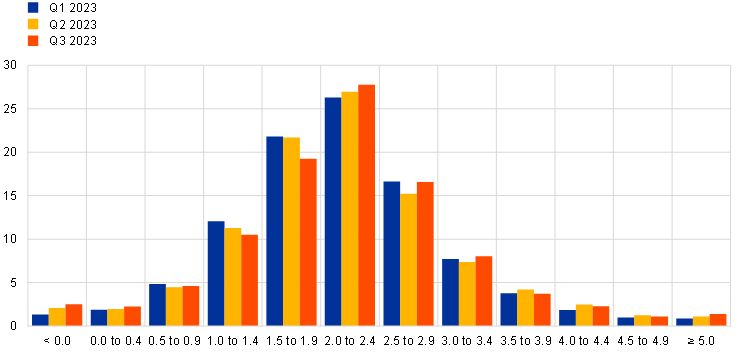
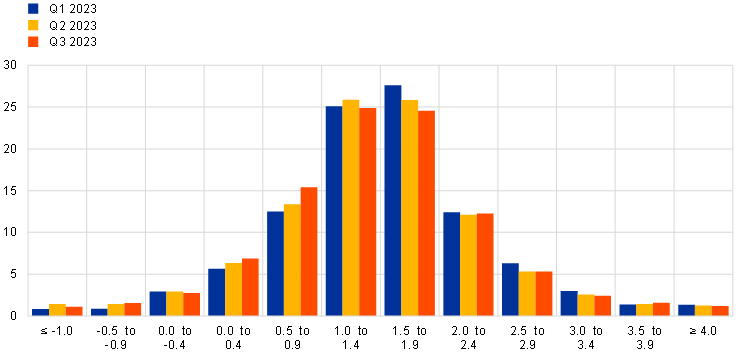
Despite easing substantially, quantitative indicators of uncertainty surrounding the shorter and medium-term inflation outlook remained above levels observed prior to 2022.[2] The high level of “aggregate uncertainty” (the standard deviation of the aggregate probability distribution) stemmed from a combination of a high average level of “individual uncertainty” and substantial “disagreement” across forecasters about their point forecasts. There was a decline in two-year-ahead aggregate uncertainty in this SPF round, which mainly stemmed from disagreement (measured by the standard deviation of point expectations) down to 0.6 percentage points - but it still stood at more than twice the historical average since 1999. Average individual uncertainty (measured by the average of the standard deviations of the individual probability distributions) was broadly unchanged at an elevated level (0.9 percentage points) – about 50% higher than the historical average since 1999. Aggregate probability distributions for the calendar years from 2023 to 2025 are presented in Chart 2. The quantitative balance of risk indicator (calculated as the estimated mean of the aggregate probability distribution minus the average reported point expectation) for the two-year ahead horizon remained to the upside, although the risk associated with very high outcomes of 5% or higher decreased. In their qualitative remarks, respondents noted that the main risks related to energy prices as well as to possible wage developments. For energy prices, both downside and upside risks were mentioned. Wage developments were generally considered an upside risk.
Chart 2
Aggregate probability distributions for expected inflation in 2023, 2024 and 2025
(x-axis: HICP inflation expectations, annual percentage changes; y-axis: probability, percentages)
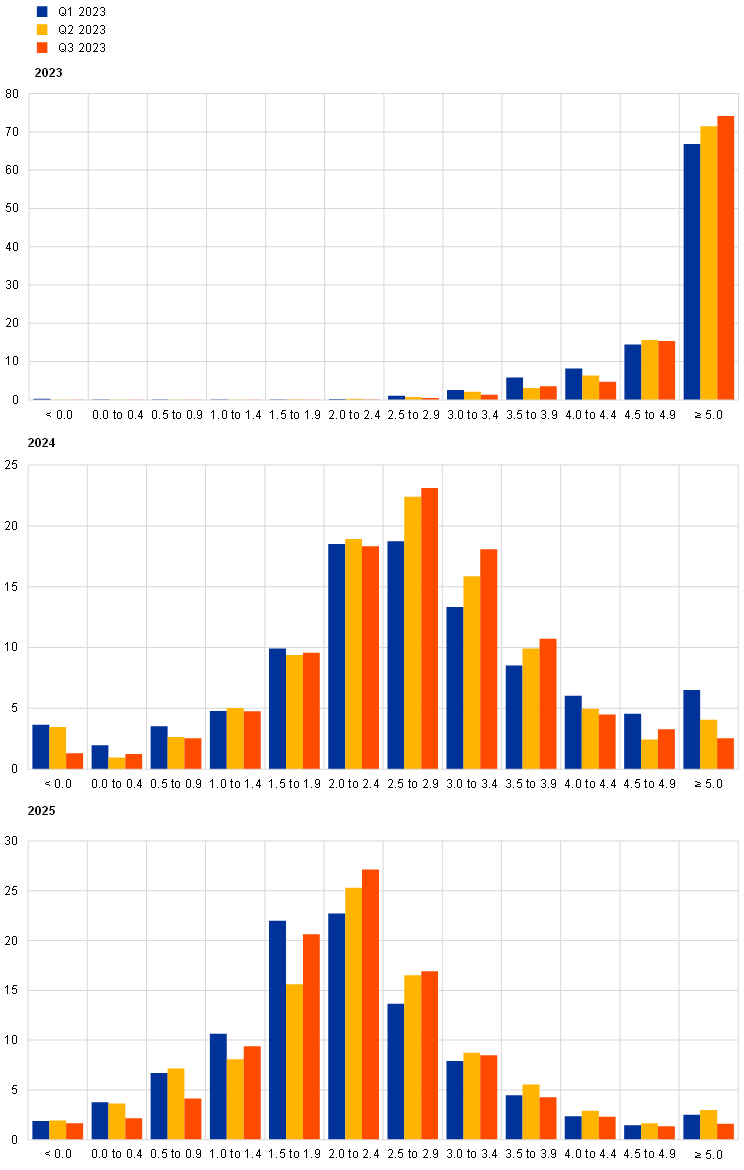
Notes: The SPF asks respondents to report their point forecasts and to separately assign probabilities to different ranges of outcomes. This chart shows the average probabilities assigned to different ranges of inflation outcomes in 2023, 2024 and 2025. To minimise the number of bins in the questionnaire, the upper bin for inflation outcomes was set at ≥ 5.0%. The fact that this would lead to most probability being assigned to the upper bin for some horizons was flagged to respondents when sending out the questionnaire.
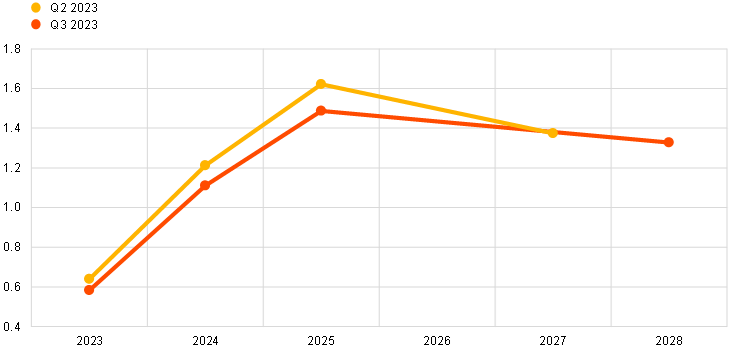
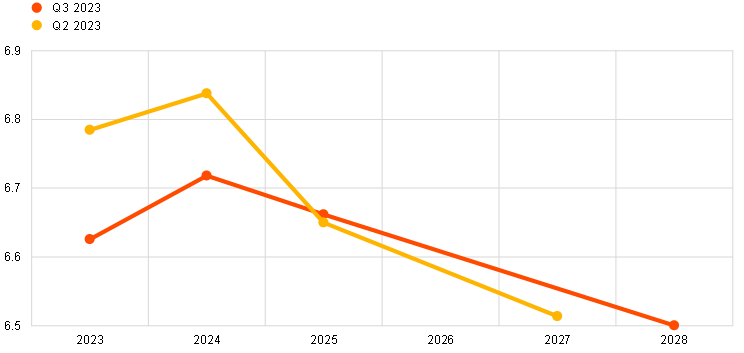
2 Longer-term inflation expectations unchanged
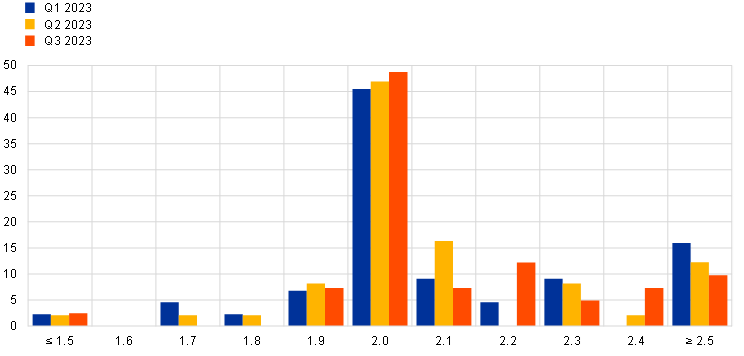
Longer-term inflation expectations (which relate to 2028) were unchanged at 2.1%. When excluding (trimming) the two highest and lowest responses, the average was stable at 2.1% for the fifth consecutive survey round.[3] The median and modal point expectations were unchanged at 2.0%, while the estimated mean of the aggregate probability distribution was unchanged at 2.1% (see Chart 3). Thus, having increased noticeably since the third quarter of 2021, there are growing signs that longer-term inflation expectations have levelled off. The modal (i.e. most frequent) and median value of the distribution of individual point forecasts was unchanged at 2.0% in this survey round (see Chart 4). However, in the past two rounds there has been a drop in the number of respondents reporting longer-term inflation expectations of below 1.9%. The distribution of longer-term inflation expectations has become much more focused on 2.0%, and expectations of inflation lower than 2% have subsided significantly.
Chart 3
Longer-term inflation expectations
(annual percentage changes)
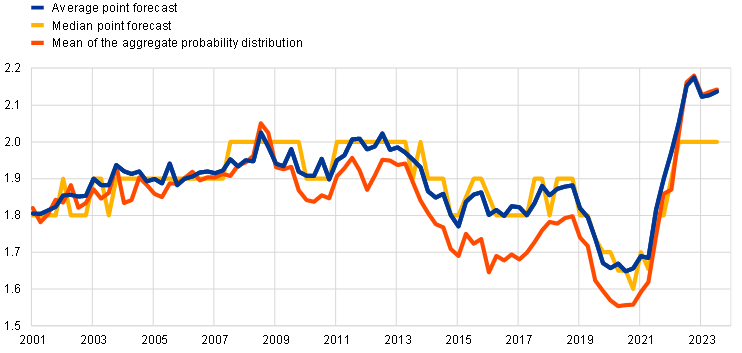
Chart 4
Distribution of point expectations for HICP inflation in the longer term
(x-axis: longer-term HICP inflation expectations, annual percentage changes; y-axis: percentages of respondents)
Notes: The SPF asks respondents to report their point forecasts and to separately assign probabilities to different ranges of outcomes. This chart shows the spread of point forecast responses. In the ECB SPF round in the third quarter of 2023, longer-term expectations referred to 2028. In the prior two rounds they referred to 2027.
Uncertainty surrounding longer-term inflation expectations remained at elevated levels, while the balance of risks remained broadly neutral. The high level of “aggregate uncertainty” (the standard deviation of the aggregate probability distribution – see Chart 5) stemmed from a combination of elevated “disagreement” (measured as the standard deviation of the individual point forecasts) and heightened “individual uncertainty” (measured by the average width of the individual probability distributions). The balance of risk indicator remained close to zero (i.e. neutral). The aggregate probability associated with longer-term inflation being in the range 1.5-2.5% decreased marginally to 47% from 49% in the previous survey round, absorbed by an increase in the probabilities associated with outcomes above this range (i.e. >2.5%), which rose to 34% from 32%. The probability associated with longer-term inflation being below this range (i.e. <1.5%) was unchanged at 20%.
Chart 5
Aggregate probability distribution for longer-term inflation expectations
(x-axis: HICP inflation expectations, annual percentage changes; y-axis: probability, percentages)
Notes: The SPF asks respondents to report their point forecasts and to separately assign probabilities to different ranges of outcomes. This chart shows the average probabilities assigned to different ranges of inflation outcomes in the longer term. In the ECB SPF round in the third quarter of 2023, longer-term expectations referred to 2028. In the prior two rounds they referred to 2027.
The mean longer-term expectations for HICP inflation excluding energy and food (HICPX) rose 0.1 percentage points to 2.1%.[4] However, the median and modal longer-term point expectations for HICPX were unchanged at 2.0%. Broadly speaking, the evolution of longer-term expectations for HICP and HICPX inflation has been similar for the period of available data since the fourth quarter of 2016 (when respondents were first asked about their expectations for HICPX), with a level difference of around 0.1 percentage points on average. However, in this survey round, the gap was closed through the upward revision of HICPX expectations, which appeared to stem from a shift to 2.0% from those reporting 1.9% or lower in the previous round.
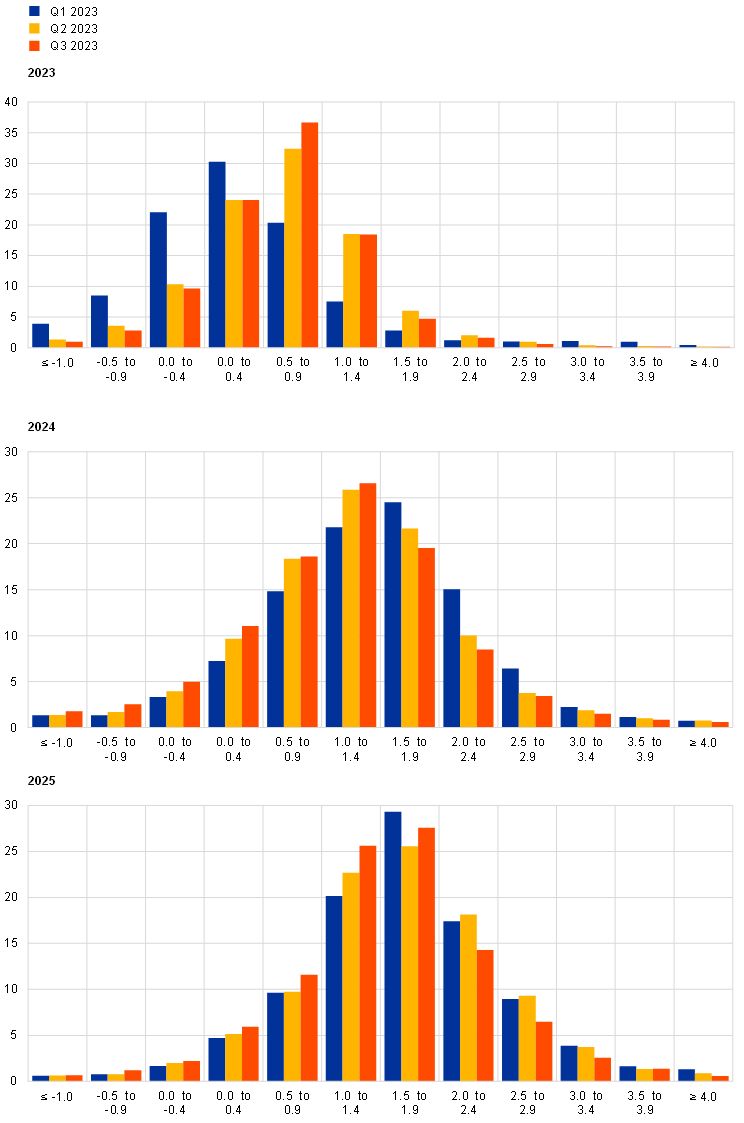
3 Real GDP growth expectations unchanged for 2023 but revised downward slightly for subsequent years
GDP growth expectations in the third quarter of 2023 stood at 0.6% for 2023, 1.1% for 2024 and 1.5% for 2025 (see Chart 6). While expectations for 2023 remained unchanged from the previous survey round, the outlook for both 2024 and 2025 was revised downward by 0.1 percentage points. Respondents reported that the easing of inflation and the upward evolution in wage growth were seen as partially offsetting the previous losses of purchasing power and thus supporting private consumption. However, tighter monetary conditions and uncertainty about possible further tightening were slowing economic activity, particularly investment. This was seen as being compounded by a slowdown due to the weak manufacturing sector, with headwinds from the slower than expected recovery in China. However, respondents considered services sector resilience as partially countering this weakness and thus broadly maintained their earlier expectations for real GDP growth in 2023. The downward revisions of 0.1 percentage points for 2024 and 2025 largely reflected growing concerns about the persistence of core inflation and its slower than expected decline. In this context, decisions regarding the pace and magnitude of rate hikes were seen as a significant factor in the growth outlook, as respondents considered there to be risks on both sides: easing too early, combined with inflation being more persistent than expected, carried the risk of an upward price spiral, while at the same time there was a risk of overtightening. Longer-term growth expectations (which refer to 2028) stood at 1.3%, down from 1.4% (for 2027) in the previous survey round.
Chart 6
Expectations for real GDP growth
(annual percentage changes)
The profile of respondents’ short-term GDP outlook (from the second quarter of 2023 to the first quarter of 2024) implies a modest, but constant, increase in economic activity over this period.[5] Actual quarter-on-quarter real GDP growth for the first quarter of 2023 was -0.1% and thus less than the forecast of 0.0% in the previous SPF round. In this round, forecasters expected average quarter-on-quarter growth of 0.2% from the second quarter of 2023 to the first quarter of 2024 (see Chart 7). Compared with the last survey round, the share of forecasters that expected at least one quarter of negative growth over the next four quarters fell to 23% (from 35%), and the share forecasting a “technical recession” (i.e. two consecutive quarters of negative growth) over this period declined to 7% (from 11%). In comparison with the June 2023 Eurosystem staff macroeconomic projections, SPF forecasts indicate a more conservative outlook for the period between the second quarter of 2023 and the first quarter of 2024, predicting a quarter-on-quarter growth rate that is 0.1 percentage points lower, on average, across the four quarters.
Chart 7
Expected profile of quarter-on-quarter GDP growth
(quarter-on-quarter percentage changes)
Note: Grey area indicates one standard deviation (of individual expectations) around average SPF expectations.
The profile for the expected level of economic activity implied by the real GDP growth rates has been revised down only slightly compared to the previous survey round. However, it remains substantially below the profile seen in the round prior to Russia’s invasion of Ukraine. Compared with the survey round for the first quarter of 2022 (conducted in early January and before the Russian invasion of Ukraine), the expected level of real GDP in 2026 has been revised down by around 3.0% (see Chart 8). Prior to the war in Ukraine, GDP was expected to surpass the profile expected pre-pandemic in the course of 2023. Now the level of GDP is expected to remain below that profile until at least 2028. Expected GDP levels in 2024 and 2025 are also lower than implied by the June 2023 Eurosystem staff macroeconomic projections (by 0.6% and 0.7%, respectively).
Chart 8
(index: 2019 = 100)

Note: Growth expectations for years not surveyed have been interpolated linearly.
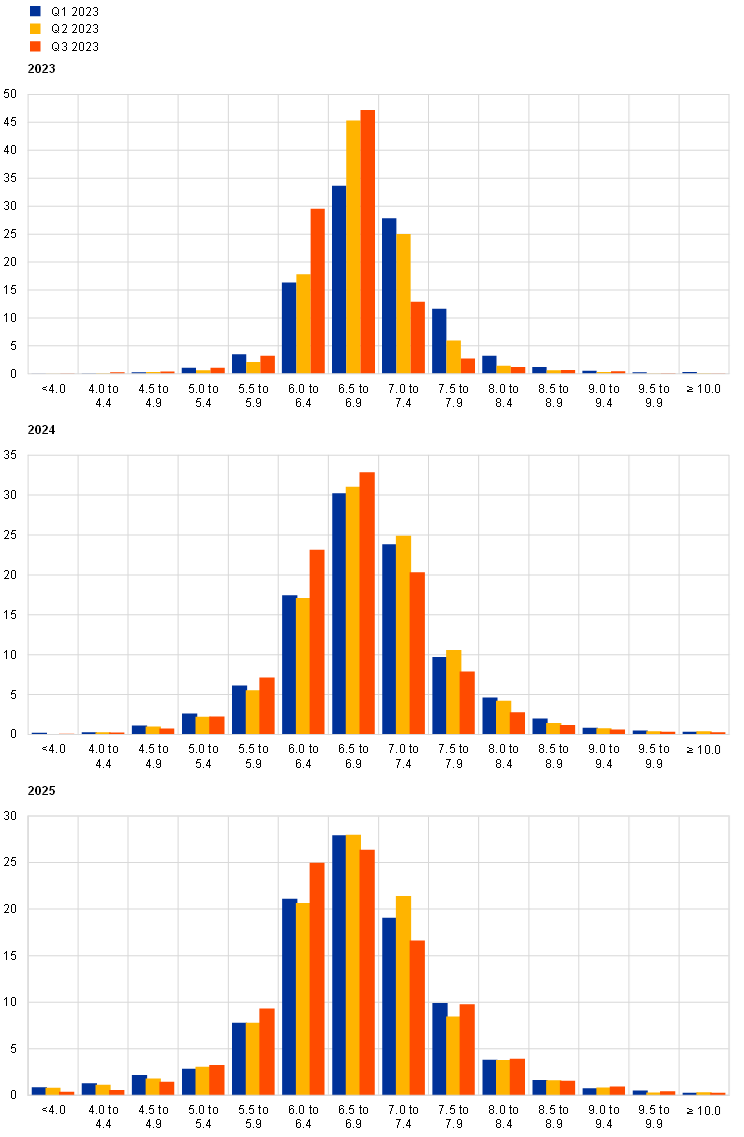
Quantitative measures of uncertainty surrounding the growth outlook remained on similar levels as in the previous survey round, while the balance of risks decreased sharply at the two-year horizon (see Chart 9 and Chart 10). Aggregate uncertainty was unchanged at the two-years-ahead and longer-term horizons, remaining above the levels which prevailed prior to the COVID-19 pandemic, but it was still considerably lower than at its peak in the second and third quarters of 2020. The balance of risks fell substantially for the two-years-ahead horizon, moving to levels below zero. For the longer-term horizon, it remained positive, with a slight upward movement compared with the previous round.
Chart 9
Aggregate probability distributions for GDP growth expectations for 2023, 2024 and 2025
(x-axis: real GDP growth expectations, annual percentage changes; y-axis: probability, percentages)
Notes: The SPF asks respondents to report their point forecasts and to separately assign probabilities to different ranges of outcomes. This chart shows the average probabilities assigned to different ranges of real GDP growth outcomes in 2023, 2024 and 2025.
Chart 10
Aggregate probability distributions for longer-term GDP growth expectations
(x-axis: real GDP growth expectations, annual percentage changes; y-axis: probability, percentages)
Notes: The SPF asks respondents to report their point forecasts and to separately assign probabilities to different ranges of outcomes. This chart shows the average probabilities assigned to different ranges of real GDP growth outcomes in the longer term. In the ECB SPF round in the third quarter of 2023, longer-term expectations referred to 2028. In the prior two rounds they referred to 2027.
4 Unemployment rate expectations revised downward slightly for 2023 and 2024, but unchanged for the longer term
In the third quarter of 2023, respondents expected unemployment rates of 6.6%, 6.7% and 6.7% for 2023, 2024 and 2025 respectively. These were revised downward from the previous survey round by 0.2 and 0.1 percentage points for 2023 and 2024, and revised upward by 0.1 percentage points for 2025. The expectation for long-term unemployment (2028) was 6.5%, unchanged from the previous round (which asked about 2027) and still close to the historical low of 6.4%. After increases in 2023 and 2024, the unemployment rate was expected to follow a downward-sloping trajectory, similar to what was observed in the previous round (see Chart 11). Respondents reported that the main factors for their downward revisions in the short term were a more robust labour market than could have been expected on the basis of economic activity, large businesses’ hiring intentions and job retention. Looking ahead, employment growth was expected to be weaker in 2024 and 2025 than in 2023, mainly due to modest economic growth expectations. In this context, if economic activity were to be disappointing, respondents considered that firms might first act along the intensive margin (hours). Nevertheless, they mentioned weaker than expected economic growth as an upside risk for unemployment.
Chart 11
Expectations for the unemployment rate
(percentages of the labour force)
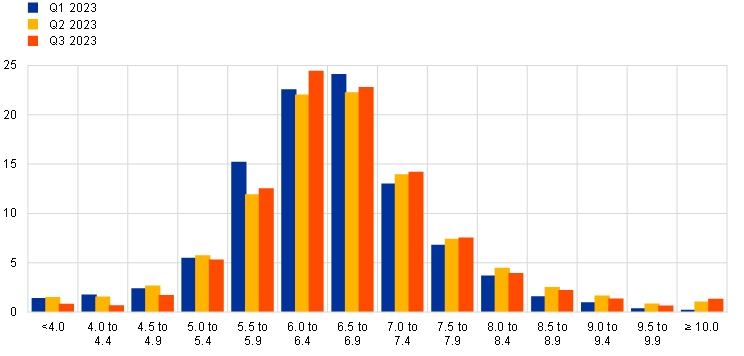
The level of uncertainty regarding short and long-term unemployment rate expectations increased, remaining at relatively high levels. “Aggregate uncertainty” has fluctuated around elevated levels (higher than those prevailing before the pandemic) in recent survey rounds. Generally, the quantitative balance of risks indicator was slightly positive for most horizons (except for two years ahead, where it was approximately neutral) and, on balance, the aggregate probability distributions exhibited somewhat positive skewness (see Chart 12 and Chart 13). For longer-term unemployment rate expectations, the balance of risks indicator was marginally positive, with the mean of the aggregate probability distribution (6.7%) above the average point forecast (6.5%).
Chart 12
Aggregate probability distributions for the unemployment rate in 2023, 2024 and 2025
(x-axis: unemployment rate expectations, percentages of the labour force; y-axis: probability, percentages)
Notes: The SPF asks respondents to report their point forecasts and to separately assign probabilities to different ranges of outcomes. This chart shows the average probabilities assigned to different ranges of unemployment rate outcomes for 2023, 2024 and 2025.
Chart 13
Aggregate probability distribution for the unemployment rate in the longer term
(x-axis: unemployment rate expectations, percentages of the labour force; y-axis: probability, percentages)
Notes: The SPF asks respondents to report their point forecasts and to separately assign probabilities to different ranges of outcomes. This chart shows the average probabilities assigned to different ranges of unemployment rate outcomes in the longer term. In the ECB SPF round in the third quarter of 2023, longer-term expectations referred to 2028. In the prior two rounds they referred to 2027.
5 Expectations for other variables
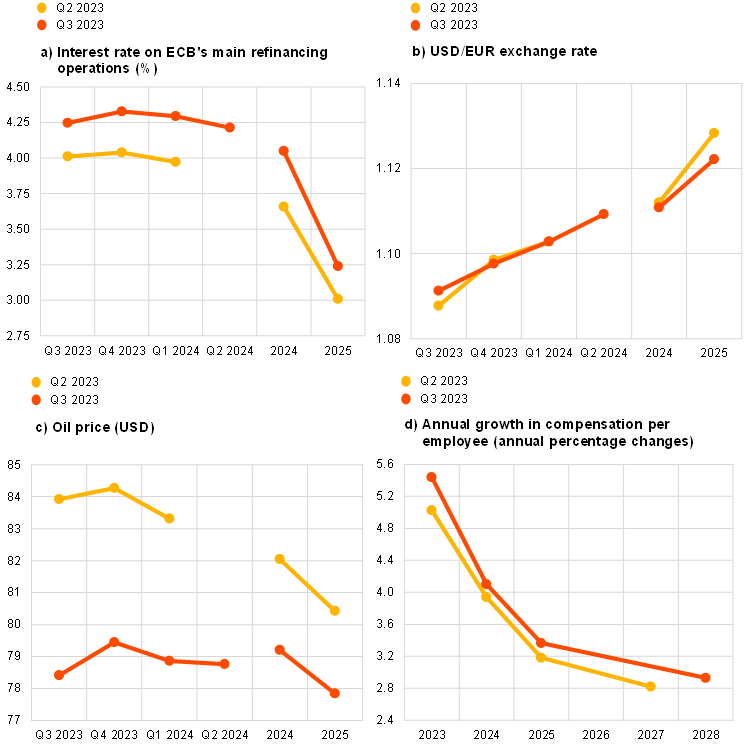
Forecasters expected the rate on the ECB’s main refinancing operations (MROs) to increase to 4.25% in the third quarter of 2023 and to remain at this level up to the second quarter of 2024, before easing in the second half of 2024 and further in 2025, falling to 3.25%. They expected the euro to appreciate marginally against the US dollar and oil prices to remain in a narrow range just above USD 77 per barrel. And they expected nominal wage growth to increase in 2023 before moderating in subsequent years.
Respondents expected the ECB’s MRO interest rate to increase to 4.25% in the third quarter of 2023. They expected it to remain around this level for the remainder of 2023 and the first two quarters of 2024, before declining slightly in the second half of 2024 and falling to 3.25% in 2025 (see Chart 14a). While the peak average expectation was 4.33% (previously 4.04%) for the fourth quarter of 2023, it was relatively balanced among respondents who expected the rate to be either 4.25% or 4.5%. Compared with the previous survey round, the profile of the entire horizon was revised up by around 0.25 percentage points.
The expected average USD/EUR exchange rate was broadly consistent with expectations from the previous survey round of levels between 1.09 and 1.11 in 2023 and 2024, but with a slight downward revision from 1.13 to 1.12 in 2025 (see Chart 14b).
Compared with the previous round, expected US dollar-denominated oil prices were revised downward for the entire horizon. This represents a downward level shift as respondents still envisaged a relatively flat trajectory similar to the previous survey round, but now with lower levels of between USD 77 and USD 78 per barrel up to 2025 (see Chart 14c).
Expectations for annual growth in compensation per employee were 5.4% for 2023, 4.1% for 2024 and 3.4% for 2025. For the longer term they were 3.0%. This implied upward revisions of 0.4 percentage points for 2023, 0.1 percentage points for 2024 and 0.2 percentage points for 2025 (see Chart 14d).
Chart 14
Expectations for other variables
Annex (chart data)
Excel data for all charts can be downloaded here.
© European Central Bank, 2023
Postal address 60640 Frankfurt am Main, Germany
Telephone +49 69 1344 0
Website http://www.ecb.europa.eu
All rights reserved. Reproduction for educational and non-commercial purposes is permitted provided that the source is acknowledged.
For specific terminology please refer to the ECB glossary (available in English only).
PDF ISBN , ISSN , doi:,
HTML ISBN , ISSN , doi:,
The survey was conducted between 30 June and 5 July 2023, with 54 responses received. This is in line with the historical average for the response rate in rounds conducted in the third quarter of the year. Participants were provided with a common set of the latest available data for annual HICP inflation (June 2023 flash estimates: overall inflation, 5.5%; underlying inflation, 5.4%), annual GDP growth (first quarter of 2023, 1.0%) and unemployment (May 2023, 6.5%). This report was drafted on the basis of data available on 14 July 2023.
The width of the reported probability distributions indicates the perceived degree of overall uncertainty, whereas the asymmetry of the distributions indicates whether that uncertainty is more concentrated on higher or lower outturns – i.e. it measures the perceived balance of risks. As regards uncertainty, it can be shown that the width (or standard deviation) of the aggregate probability distribution (i.e. “aggregate uncertainty”) is a function of the average width (or standard deviations) of the individual probability distributions (i.e. “individual uncertainty”) and the standard deviation of the individual point forecasts (i.e. “disagreement”).
Looking at a balanced panel of 37 respondents who participated in both the second and third quarters of 2023, seven of those respondents revised their longer-term inflation expectations upward, eight revised them downward and 22 made no changes.
Of the 28 respondents who provided longer-term HICPX expectations in both the third and second quarters of 2023, 17 made no changes to their forecasts, seven revised them up and four revised them down.
Based on data from 44 respondents.
- 28 July 2023