
Summary
In the ECB’s Survey of Professional Forecasters (SPF) for the first quarter of 2024, expectations for headline HICP inflation, and those for HICP inflation excluding energy and food (HICPX), were revised down compared to the previous survey (conducted in the fourth quarter of 2023).[1] Based on respondents’ qualitative information, the downward revisions mainly reflected the impact of lower than previously expected HICP data outturns and oil prices, as well as weaker economic activity. Headline inflation was expected to decline from 2.4% in 2024 to 2.0% in both 2025 and 2026. Longer-term HICP inflation expectations (for 2028) were also revised down, by 0.1 percentage points to 2.0%. Real GDP growth expectations were revised down for 2024 and 2025. Respondents expected a slight contraction in real GDP in the final quarter of 2023, followed by a slow recovery of economic activity throughout 2024. Longer-term GDP growth expectations were unchanged at 1.3%. Unemployment expectations were largely unchanged from the previous survey round. Respondents continued to expect the unemployment rate to increase to 6.7% in 2024 but to decline gradually thereafter to 6.5% in 2026 and to remain at 6.5% in the longer term.
Table 1
Results of the SPF in comparison with other expectations and projections
(annual percentage changes, unless otherwise indicated)
Survey horizon | ||||
|---|---|---|---|---|
2024 | 2025 | 2026 | Longer term1) | |
HICP inflation | ||||
Q1 2024 SPF | 2.4 | 2.0 | 2.0 | 2.0 |
Previous SPF (Q4 2023) | 2.7 | 2.1 | - | 2.1 |
Eurosystem staff macroeconomic projections (December 2023) | 2.7 | 2.1 | 1.9 | - |
Consensus Economics (January 2024) | 2.2 | 2.0 | 2.0 | 2.0 |
Memo: HICP inflation excluding energy, food, alcohol and tobacco | ||||
Q1 2024 SPF | 2.6 | 2.1 | 2.0 | 2.0 |
Previous SPF (Q4 2023) | 2.9 | 2.2 | - | 2.0 |
Eurosystem staff macroeconomic projections (December 2023) | 2.7 | 2.3 | 2.1 | - |
Consensus Economics (January 2024) | 2.5 | 2.1 | - | - |
Real GDP growth | ||||
Q1 2024 SPF | 0.6 | 1.3 | 1.4 | 1.3 |
Previous SPF (Q4 2023) | 0.9 | 1.5 | - | 1.3 |
Eurosystem staff macroeconomic projections (December 2023) | 0.8 | 1.5 | 1.5 | - |
Consensus Economics (January 2024) | 0.5 | 1.3 | 1.5 | 1.3 |
Unemployment rate2) | ||||
Q1 2024 SPF | 6.7 | 6.6 | 6.5 | 6.5 |
Previous SPF (Q4 2023) | 6.7 | 6.6 | - | 6.5 |
Eurosystem staff macroeconomic projections (December 2023) | 6.6 | 6.5 | 6.4 | - |
Consensus Economics (January 2024) | 6.8 | 6.8 | - | - |
1) Longer-term expectations refer to 2028.
2) As a percentage of the labour force.
1 HICP inflation expectations revised down for 2024-25
SPF respondents revised down their HICP inflation expectations for 2024 and 2025. Compared to the previous survey round, inflation expectations for 2024 were revised down by 0.3 percentage points to 2.4% and those for 2025 were revised down by 0.1 percentage points to 2.0% (see Chart 1). Expectations for 2026 (which were not surveyed in the previous round) stood at 2.0%. Respondents’ qualitative explanations suggest the downward revisions mainly reflected the impact of lower than previously expected oil prices and data outturns for headline HICP as well as weaker economic activity. Compared with the December 2023 Eurosystem staff macroeconomic projections, inflation expectations in this SPF round were 0.3 and 0.1 percentage points lower for 2024 and 2025 respectively but 0.1 percentage points higher for 2026 (see Table 1).
Chart 1
Inflation expectations: overall HICP inflation and HICP inflation excluding energy and food
(annual percentage changes)
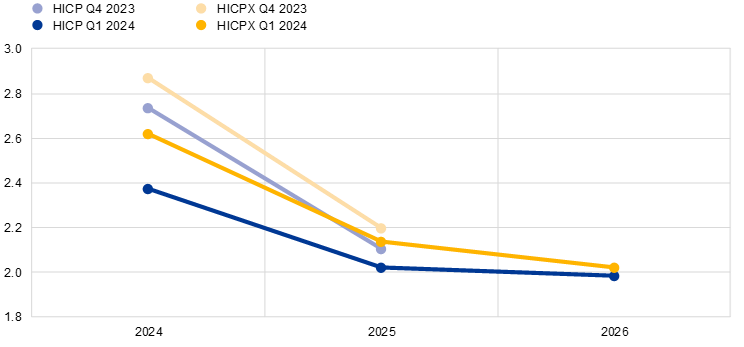
SPF expectations for inflation excluding energy and food were also revised down for 2024 and 2025. HICPX inflation expectations for 2024, 2025 and 2026 stood at 2.6%, 2.1% and 2.0% respectively – representing downward revisions of 0.3 percentage points for 2024 and 0.1 percentage points for 2025. Respondents indicated that the downward revisions reflected the impact of lower than previously expected data outturns for HICPX inflation as well as weaker economic activity. The downward revisions to the HICPX expectations bring them below the projections in the December 2023 Eurosystem staff macroeconomic projections (see Table 1) by 0.2 percentage points for both 2024 and 2025 and by 0.1 percentage points for 2026.
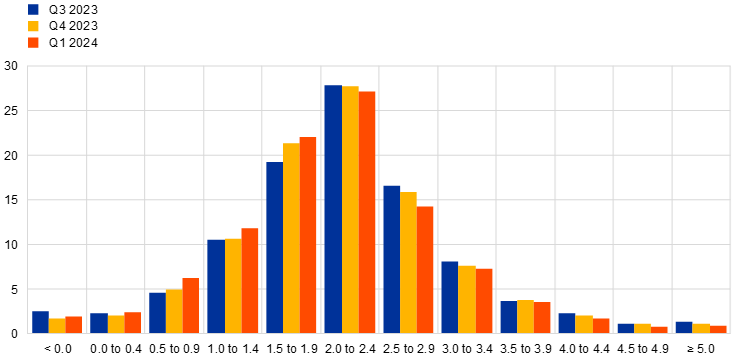
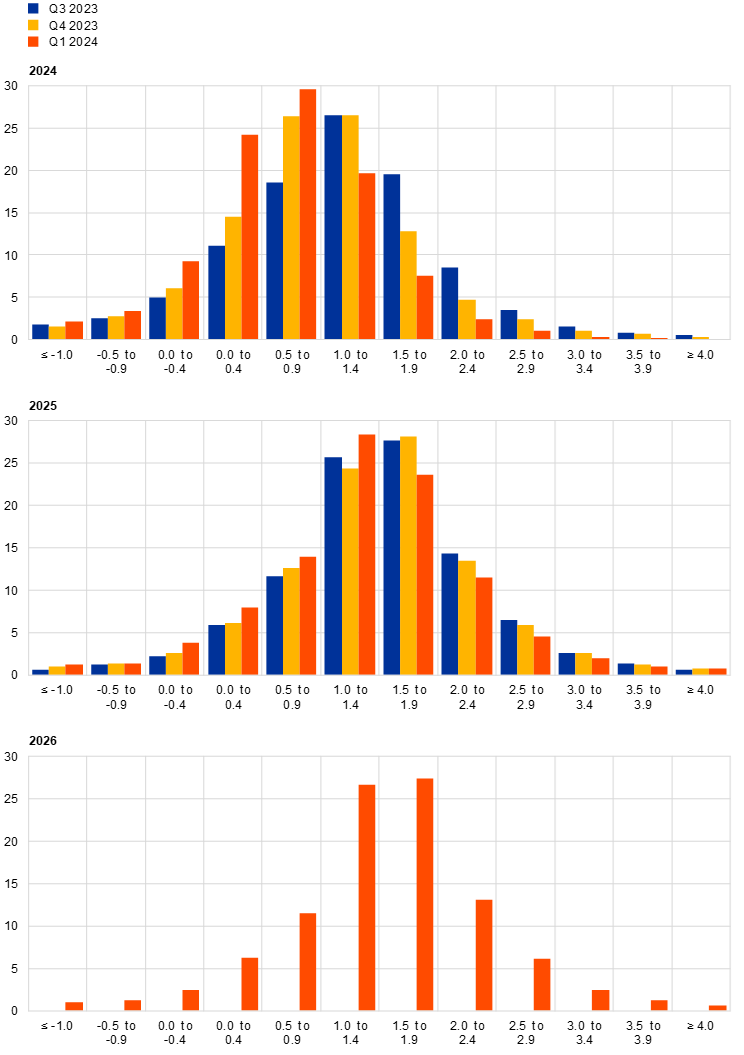
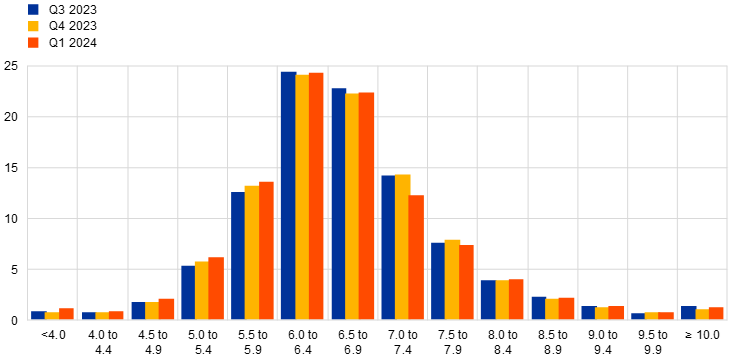
Quantitative indicators of uncertainty surrounding the short and medium-term inflation outlook remained at elevated levels, while the balance of risks became less tilted to the upside.[2] The high level of “aggregate uncertainty” (the standard deviation of the aggregate probability distribution) stemmed from a combination of a high average level of “individual uncertainty” (measured by the average width of the individual probability distributions) and substantial “disagreement” across forecasters about their point forecasts (measured as the standard deviation of the individual point forecasts). Aggregate probability distributions for the calendar years from 2024 to 2026 are presented in Chart 2. The balance of risk indicator for the two-years-ahead horizon remained to the upside but eased noticeably. According to the qualitative remarks, the main uncertainties and upside risks relate to geopolitical developments, energy prices and wage outcomes. On the other hand, some respondents pointed to weaker economic growth and further euro appreciation as downside risks.
Chart 2
Aggregate probability distributions for expected inflation in 2024, 2025 and 2026
(x-axis: HICP inflation expectations, annual percentage changes; y-axis: probability, percentages)
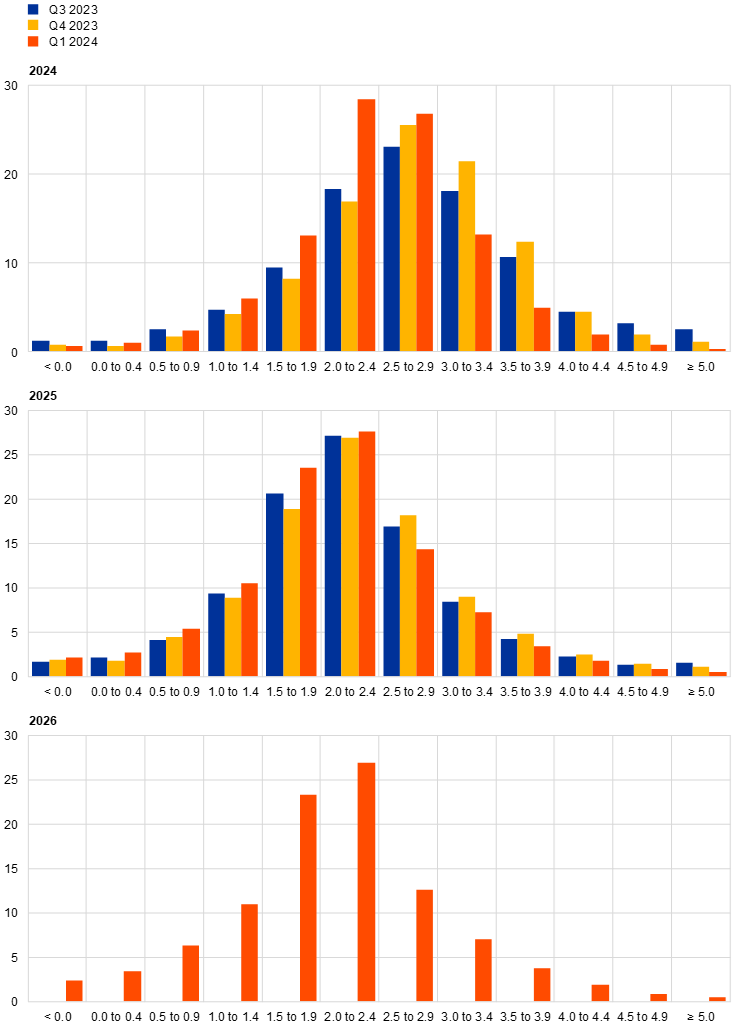
Notes: The SPF asks respondents to report their point forecasts and to separately assign probabilities to different ranges of outcomes. This chart shows the average probabilities assigned to different ranges of inflation outcomes in 2024, 2025 and 2026. Expectations for 2026 were not surveyed in the third and fourth quarter of 2023 rounds.
2 Longer-term inflation expectations revised down to 2.0%
Longer-term inflation expectations (which relate to 2028) were revised down by 0.1 percentage points to 2.0%. Thus, having stood at 2.1% since the second quarter of 2022 (after the Russian invasion of Ukraine), average longer-term inflation expectations in the SPF have moved back to 2.0%. This evolution also holds when excluding the two highest and lowest responses or when considering a balanced panel of those who also replied in the fourth quarter of 2023 survey round.[3] The median and modal point expectations were unchanged at 2.0% (see Chart 3). In this survey round there was also a notable change in the shape of the distribution of longer-term point expectations. In particular, there was a drop off in respondents reporting longer-term inflation expectations of 2.2% or above and an increase in those reporting 2.0% or 2.1% (see Chart 4).
Chart 3
Longer-term inflation expectations
(annual percentage changes)
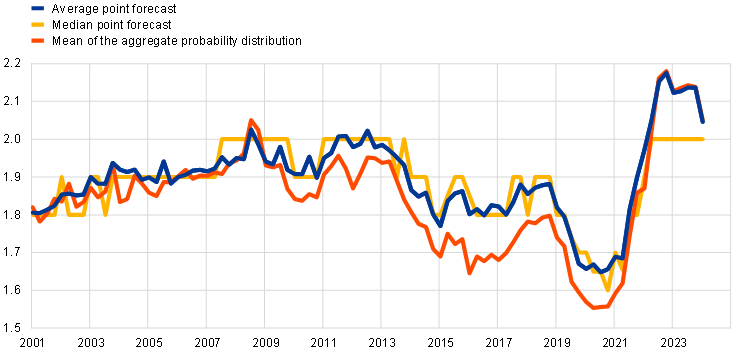
Chart 4
Distribution of point expectations for HICP inflation in the longer term
(x-axis: longer-term HICP inflation expectations, annual percentage changes; y-axis: percentages of respondents)
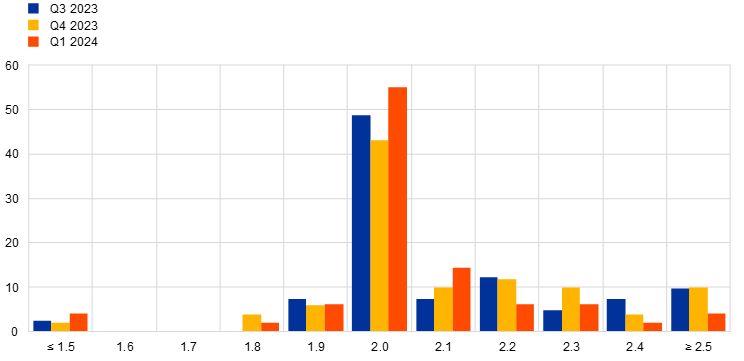
Notes: The SPF asks respondents to report their point forecasts and to separately assign probabilities to different ranges of outcomes. This chart shows the spread of point forecast responses. Longer-term expectations refer to 2028.
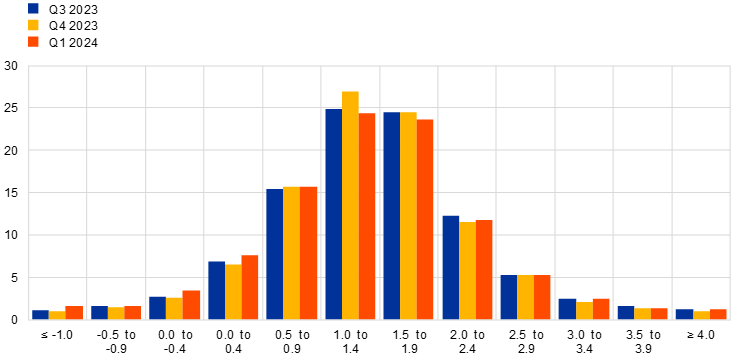
Uncertainty surrounding longer-term inflation expectations remained at elevated levels, while the balance of risks remained broadly neutral. The high level of “aggregate uncertainty” (see Chart 5) stemmed from a combination of elevated “disagreement” and heightened “individual uncertainty”. The balance-of-risk indicator remained close to zero (i.e. neutral). The probability of longer-term inflation being in the range 1.5-2.5% was unchanged at 49%, while the probability associated with outcomes above this range (28%) was slightly greater than the probability associated with outcomes below this range (23%).
Chart 5
Aggregate probability distribution for longer-term inflation expectations
(x-axis: HICP inflation expectations, annual percentage changes; y-axis: probability, percentages)
Notes: The SPF asks respondents to report their point forecasts and to separately assign probabilities to different ranges of outcomes. This chart shows the average probabilities assigned to different ranges of inflation outcomes in the longer term. Longer-term expectations refer to 2028.
The mean longer-term expectation for HICP inflation excluding energy and food (HICPX) was unchanged at 2.0%.[4] The median and modal longer-term point expectations for HICPX inflation were also unchanged at 2.0%. Broadly speaking, since the fourth quarter of 2016 (when respondents were first asked about their expectations for HICPX inflation) the evolution of longer-term expectations for HICPX inflation has been similar to that for HICP inflation, with a difference in levels of around 0.1 percentage points on average, although this gap narrowed somewhat in this survey round.
3 Real GDP growth expectations revised down for 2024 and 2025
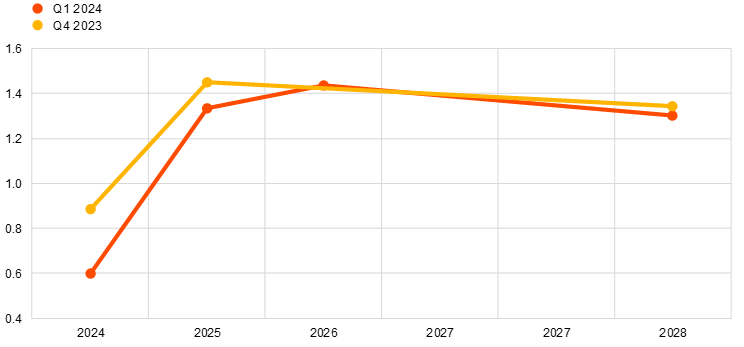
GDP growth expectations in the first quarter of 2024 survey round stood at 0.6% for 2024, 1.3% for 2025 and 1.4% for 2026 (see Chart 6). Compared to the previous survey round, these figures represent downward revisions of 0.3 percentage points for 2024 and 0.2 percentage points for 2025 (expectations for 2026 were not surveyed in the previous round). The qualitative comments pointed to a more cautious outlook due largely to geopolitical tensions, particularly in the Middle East, and their impact on business and consumer confidence. At the same time, higher wage growth and declining headline inflation were still expected to boost real household income and support household spending. Longer-term growth expectations (referring to 2028) were 1.3%, the same as in the previous survey round.
Chart 6
Expectations for real GDP growth
(annual percentage changes)
Respondents’ short-term GDP outlook includes a slight contraction in the final quarter of 2023, followed by slow recovery of economic activity throughout 2024.[5] Expectations for quarter-on-quarter GDP growth for the period between the fourth quarter of 2023 and the third quarter of 2024 were slightly lower than in both the previous survey round and the December 2023 Eurosystem staff macroeconomic projections (see Chart 7). Respondents noted that a key factor behind their expectations of a pickup in activity over the course of 2024 is the boost from rising real incomes as inflation falls further.
Chart 7
Expected profile of quarter-on-quarter GDP growth
(quarter-on-quarter percentage changes)
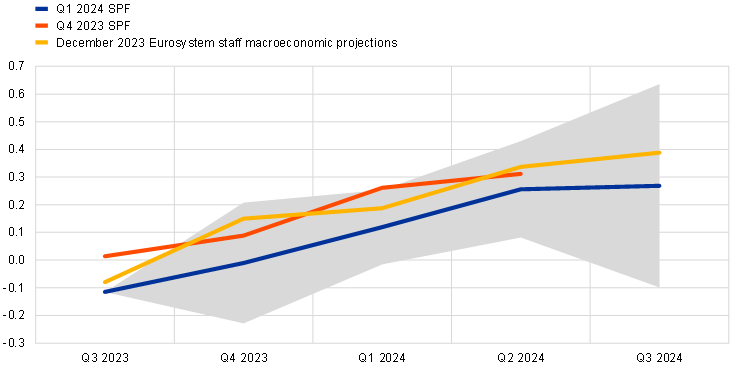
Note: The grey area indicates one standard deviation (of individual expectations) around average SPF expectations.
The level of economic activity implied by the growth expectations has been revised down slightly compared to the previous survey round and remains substantially below the level implied by growth expectations prior to Russia’s invasion of Ukraine. Compared to the SPF round for the first quarter of 2022 (conducted in early January, before the invasion of Ukraine), the implied level of real GDP for 2026 is about 3.5% lower (see Chart 8). Compared to the December 2023 Eurosystem staff macroeconomic projections, it is lower by between 0.3% and 0.6% for the years 2024 to 2026.
Chart 8
Forecast profile of real GDP
(index: 2022 = 100)
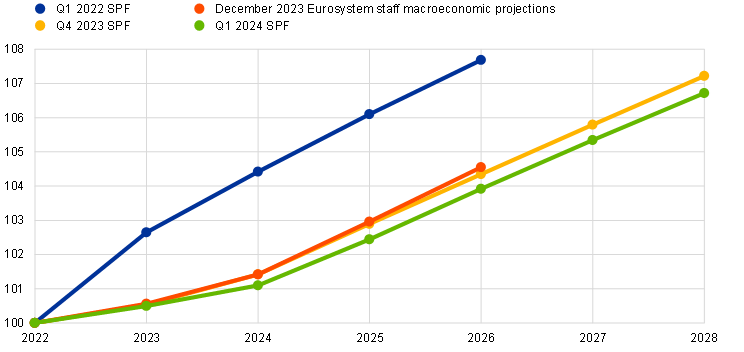
Note: Growth expectations for years not surveyed have been interpolated linearly.
Uncertainty about the growth outlook remained at elevated levels (see Chart 9 and Chart 10). Aggregate uncertainty decreased slightly at the two-years-ahead horizon and increased at the longer horizon, remaining in both cases above the levels prevailing prior to the coronavirus (COVID-19) pandemic but considerably lower than the peaks reached in 2020. After a substantial fall in the third quarter of 2023 survey round and only a slight rise in the fourth quarter of 2023 round, the balance of risks for the two-years-ahead horizon rose strongly and is now close to zero (i.e. neutral). For the longer horizon, it remained positive with a small upward movement compared to the previous survey round.
Chart 9
Aggregate probability distributions for GDP growth expectations for 2024, 2025 and 2026
(x-axis: real GDP growth expectations, annual percentage changes; y-axis: probability, percentages)
Notes: The SPF asks respondents to report their point forecasts and to separately assign probabilities to different ranges of outcomes. This chart shows the average probabilities assigned to different ranges of real GDP growth outcomes in 2024, 2025 and 2026. Expectations for 2026 were not surveyed in the third and fourth quarter of 2023 rounds.
Chart 10
Aggregate probability distributions for longer-term GDP growth expectations
(x-axis: real GDP growth expectations, annual percentage changes; y-axis: probability, percentages)
Notes: The SPF asks respondents to report their point forecasts and to separately assign probabilities to different ranges of outcomes. This chart shows the average probabilities assigned to different ranges of real GDP growth outcomes in the longer term. Longer-term expectations refer to 2028.
4 Unemployment rate expectations largely unchanged
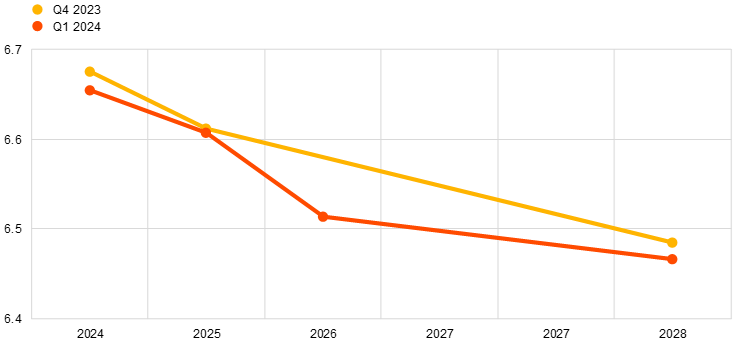
In the first quarter of 2024 survey round, respondents expected unemployment rates of 6.7%, 6.6% and 6.5% for 2024, 2025 and 2026 respectively. Similar to the trajectory of the previous round, the numbers imply that the unemployment rate is expected to increase in 2024 and then gradually decrease over the rest of the horizon (see Chart 11). Expectations for 2024 and 2025 were largely unchanged compared to the previous survey round, and the same holds for longer-term unemployment (2028). Respondents noted that the labour market has remained surprisingly resilient relative to real economic conditions and the economic cycle. Despite this resilience, respondents still expect some increase in the unemployment rate in 2024 given weak economic activity and increased labour costs. In the longer term, unemployment is still expected to fall, primarily owing to the expected pickup in economic activity but also owing to demographic factors.
Chart 11
Expectations for the unemployment rate
(percentages of the labour force)
The level of uncertainty regarding short and longer-term unemployment rate expectations remained at relatively high levels. Aggregate uncertainty has fluctuated around elevated levels (higher than those prevailing before the pandemic) in recent survey rounds. Regarding risks, respondents noted primarily upside risks to the unemployment outlook amid the weak outlook for growth and slightly higher than previously expected labour cost increases in 2024 and 2025 (see Chart 12 and Chart 13).
Chart 12
Aggregate probability distributions for the unemployment rate in 2024, 2025 and 2026
(x-axis: unemployment rate expectations, percentages of the labour force; y-axis: probability, percentages)
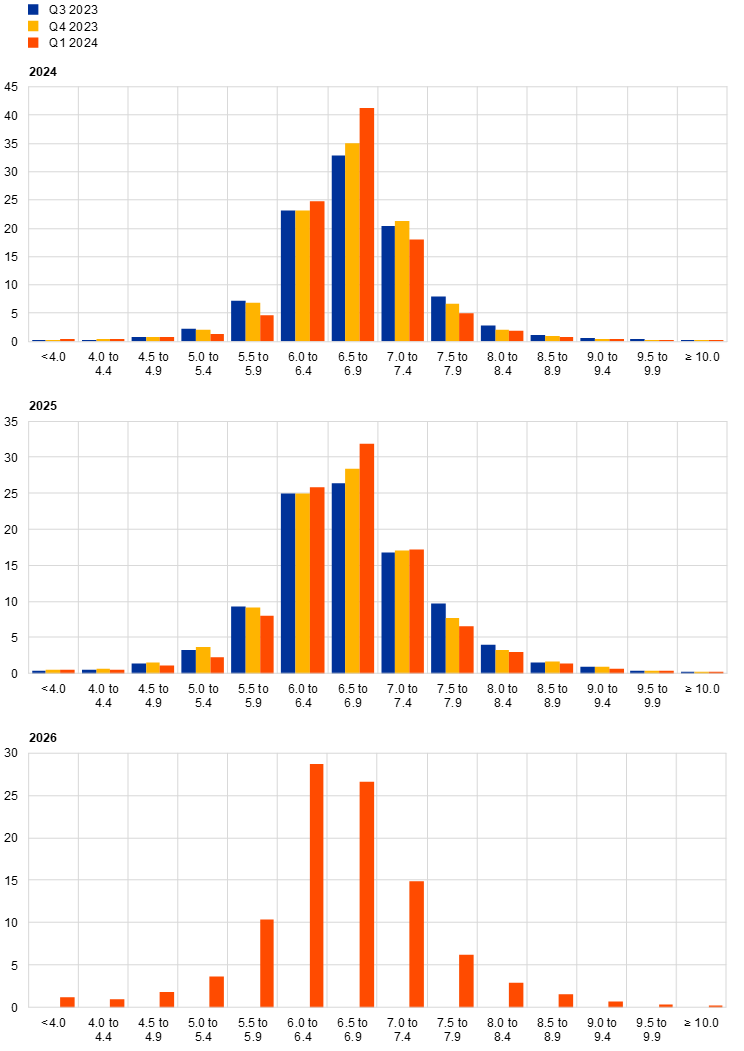
Notes: The SPF asks respondents to report their point forecasts and to separately assign probabilities to different ranges of outcomes. This chart shows the average probabilities assigned to different ranges of unemployment rate outcomes for 2024, 2025 and 2026. Expectations for 2026 were not surveyed in the third and fourth quarter of 2023 rounds.
Chart 13
Aggregate probability distribution for the unemployment rate in the longer term
(x-axis: unemployment rate expectations, percentages of the labour force; y-axis: probability, percentages)
Notes: The SPF asks respondents to report their point forecasts and to separately assign probabilities to different ranges of outcomes. This chart shows the average probabilities assigned to different ranges of unemployment rate outcomes in the longer term. Longer-term expectations refer to 2028.
5 Expectations for other variables
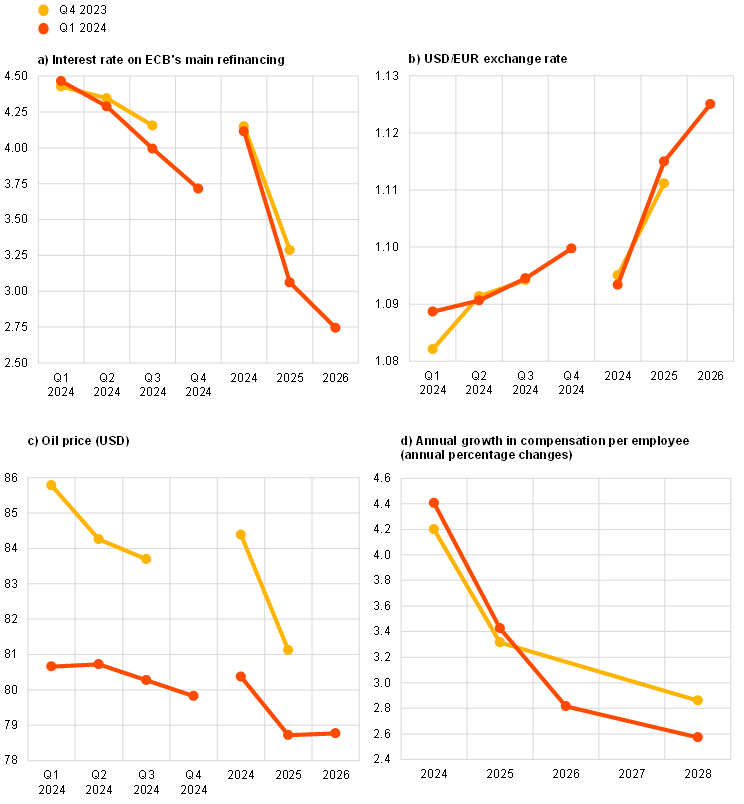
Forecasters expected the rate on the ECB’s main refinancing operations (MROs) to remain at 4.5% in the first quarter of 2024 before easing from the second quarter of 2024, reaching 3.75% by the fourth quarter of 2024 and falling further to 3.0% in 2025 and 2.75% in 2026. They expected the euro to appreciate marginally against the US dollar, from USD 1.09 in the first quarter of 2024 to USD 1.13 in 2026, and oil prices to remain at USD 87 per barrel in the second quarter of 2024, before falling slightly to USD 79 per barrel by 2026. They also expected nominal wages to increase by 4.2% in 2024 and 3.4% in 2025, before moderating to a growth rate of 2.8% in 2026 and 2.6% in the longer term.
Respondents expected the ECB’s MRO interest rate to remain at 4.5% in the first quarter of 2024. While mean estimates suggest that successive 25 basis point cuts are expected in each of the three subsequent quarters, the majority of respondents expect rates to be held at 4.5% in the second quarter of 2024 before falling to 4.25% in the third quarter and 3.75% in the fourth quarter. They expect further declines to 3.0% in 2025 and 2.75% in 2026 (see Chart 14a). Compared with the previous survey round, there has been a modest downward revision of the profile over 2024 and a more significant downward revision for 2025.
On average, the USD/EUR exchange rate was expected to rise from 1.09 in the first quarter of 2024 to 1.13 in 2026 (see Chart 14b). The expected profile follows a similar trajectory to the previous survey round.
Compared with the previous round, the expected level of US dollar-denominated oil prices was revised down over the entire horizon. Although respondents made a significant downward revision for the first quarter of 2024 to USD 81 per barrel from USD 87 per barrel, they expect a flatter downward trajectory thereafter with the price falling only marginally further to USD 80 per barrel by the end of 2024 and USD 79 per barrel in 2025 and then remaining at USD 79 per barrel in 2026 (see Chart 14c).
Expectations for annual growth in compensation per employee were revised up by 0.2 percentage points for 2024 and 0.1 percentage points for 2025 to 4.2% and 3.4% respectively. Respondents expected wage growth to moderate to 2.8% in 2026 and revised down their expectations of longer-term wage growth (2028) by 0.3 percentage points from 2.9% to 2.6% (see Chart 14d).
Chart 14
Expectations for other variables
Annex (chart data)
Excel data for all charts can be downloaded here.
© European Central Bank, 2024
Postal address 60640 Frankfurt am Main, Germany
Telephone +49 69 1344 0
Website www.ecb.europa.eu
All rights reserved. Reproduction for educational and non-commercial purposes is permitted provided that the source is acknowledged.
For specific terminology please refer to the ECB glossary (available in English only).
PDF ISBN 978-92-899-6453-1, ISSN 2363-3670, doi:10.2866/29782, QB-BR-24-001-EN-N
HTML ISBN 978-92-899-6454-8, ISSN 2363-3670, doi:10.2866/055279, QB-BR-24-001-EN-Q
The survey was conducted between 5 and 10 January 2024 and 59 responses were received. This is in line with the historical average for the response rate in rounds conducted in the first quarter of the year. Participants were provided with a common set of the latest available data for annual HICP inflation (December 2023 flash estimates: overall inflation, 2.9%; underlying inflation, 3.4%), annual GDP growth (third quarter of 2023, 0.0%) and unemployment (November 2023, 6.4%). This report was drafted on the basis of data available on 12 January 2024.
The width of the reported probability distributions indicates the perceived degree of overall uncertainty, whereas the asymmetry of the distributions indicates whether that uncertainty is more concentrated on higher or lower outturns – i.e. it measures the perceived balance of risks. As regards uncertainty, it can be shown that the width (or standard deviation) of the aggregate probability distribution (i.e. “aggregate uncertainty”) is a function of the average width (or standard deviation) of the individual probability distributions (i.e. “individual uncertainty”) and the standard deviation of the individual point forecasts (i.e. “disagreement”).
Of the 44 respondents who provided longer-term HICP inflation expectations in both the first quarter of 2024 and fourth quarter of 2023, 27 made no changes to their forecasts, five revised them up and 12 revised them down.
Of the 31 respondents who provided longer-term HICPX inflation expectations in both the first quarter of 2024 and fourth quarter of 2023, 22 made no changes to their forecasts, three revised them up and six revised them down.
Based on data from 48 respondents.
- 26 January 2024