


- THE ECB BLOG
Who buys bonds now? How markets deal with a smaller Eurosystem balance sheet
22 March 2024
The Eurosystem is shrinking its balance sheet, which makes more government bonds available for purchase. The ECB Blog looks at how markets are adjusting to this new situation with regard to bond price volatility, liquidity and the impact on repo markets.
Since mid-2022 the Eurosystem’s balance sheet declined by around €2,000 billion, or more than 22 per cent. The largest part of this decline is due to banks having repaid a substantial share of the loans taken from the Eurosystem via the targeted long-term refinancing operations. This has released many assets previously used as collateral back to the market, including government bonds. Moreover, the Eurosystem owns smaller amounts of bonds since it no longer reinvests maturing bonds under its asset purchase programme.
The reduction of the Eurosystem’s balance sheet and the fact that governments across the euro area have issued record amounts of debt have substantially increased the availability of bonds to the market. This has helped to bring the Eurosystem’s footprint in government bond markets closer to pre-pandemic levels (Chart 1).
But how have markets adjusted, and which other investors are stepping in to absorb the increasing amount of government bonds available to the market?
Chart 1
Size of euro area government bond market and the Eurosystem market footprint (EUR billions and %)
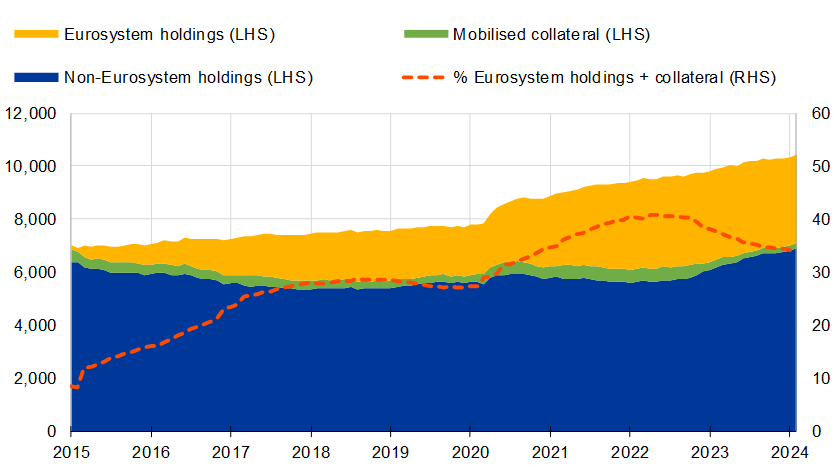
Sources: Eurosystem, CSDB.
Notes: The chart shows the evolution of the size of the euro area government bond market and splits it into the Eurosystem holdings (yellow) and mobilised collateral (green), and what is not held or mobilised as collateral with the Eurosystem (blue). The Eurosystem market footprint is a relative measure, computed as the share of the Eurosystem’s euro area government bond (EGB) holdings compared to nominal amount outstanding. Outright holdings are EGBs held by the Eurosystem via purchase programmes, adjusted with EGBs lent back via the securities lending against cash collateral facilities; mobilised collateral includes EGBs mobilised as collateral for open market operations. Last observation: 29 February 2024.
How to read the figures: In 2020 the euro area government bond market had a capitalisation of almost €8 trillion. At that time Eurosystem holdings and collateral had a value of more than €3.5 trillion, which accounted for 31.5 percent of the market.
Who stepped into the government bond market?
Chart 2 shows that various types of investors have stepped in and compensated for the Eurosystem’s reduced presence. While the Eurosystem has not actively sold bonds, it only partially replaced maturing bonds in its monetary policy portfolios[2]. Two sectors have clearly contributed the most to absorbing the new debt since the Eurosystem began to reduce its balance sheet: households and foreign investors.
Chart 2Sectoral absorption of government securities in 2023 (%) 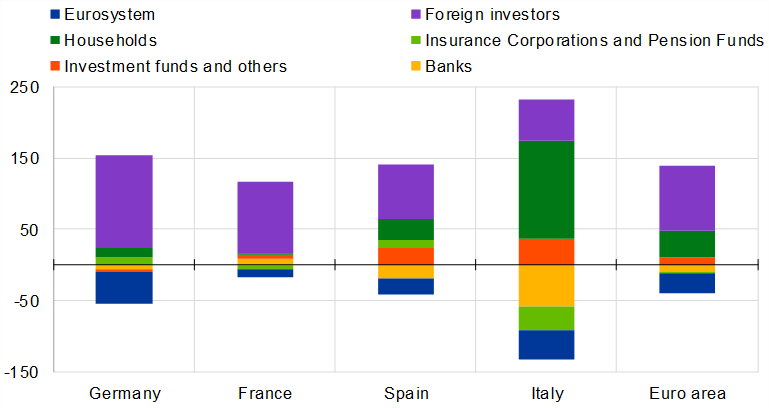 Sources: ECB, SHS. |
Historically, foreign investors were the largest holders of euro area government securities, accounting for 40% of holdings prior to the start of the Eurosystem’s asset purchase programme (Chart 3). When the Eurosystem expanded its balance sheet, however, they halved their share of euro area government bonds. As the Eurosystem ended reinvestments under the APP, they returned and absorbed a considerable amount of the net issuance of government bonds (Chart 2). Nevertheless, their share is still far smaller than it was a decade ago (Chart 3).
This return of foreign investors may not be surprising. The sector includes foreign investment funds and hedge funds, which traditionally show a high sensitivity to changes in yields, especially those of bonds issued by higher-rated euro area governments.
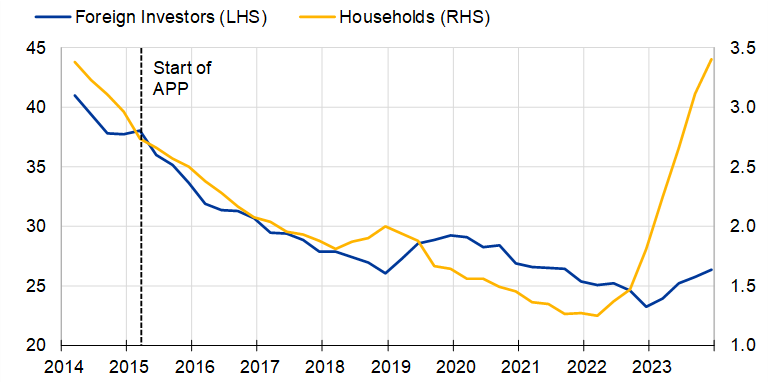
In contrast, the speed and intensity of purchases by the household sector is noteworthy. The share of government securities owned by households has returned to nearly 3.5%, close to the level prevailing before the Eurosystem launched its public sector purchase programme (PSPP) in 2015.
Several factors have made purchasing government bonds attractive for private households. Higher yields, together with governments offering dedicated retail-focused products, attracted investment from households, especially as many commercial banks were slow to pass-through higher policy rates to deposit rates. In addition, increased savings during the pandemic meant households had more money available to invest in bonds and bills.
Why did government bond markets react so smoothly?
The Eurosystem started to reduce its monetary policy bond portfolio in an environment of high government bond issuance and heightened market volatility as central banks around the world increased their policy rates to fight elevated inflation. In these conditions, the Eurosystem’s balance sheet reduction went very smoothly, with net issuance of bonds being absorbed by domestic and foreign investors.
The ability to buy or sell bonds has remained stable or even improved in recent months. This is visible from the relationship between volatility and liquidity in euro area government bond markets shown in Chart 4. Higher volatility is likely to decrease market liquidity as it increases risks to trade in the market. A clear sign of market dysfunction would be to see a deterioration of market liquidity that goes beyond what could be explained by an increase in market volatility. This is what happened in March 2020 at the beginning of the pandemic, when euro area bond markets faced severe disruptions as liquidity deteriorated dramatically and became disconnected from volatility (yellow dots). In contrast to that stress situation, recent data points (red dots) are in line with the usual relationship between bond market volatility and liquidity since 2015. This evidence is one indication that government bond markets have been functioning well during the recent period of balance sheet normalisation.
Chart 4
Relationship between liquidity and volatility in euro area government bond market
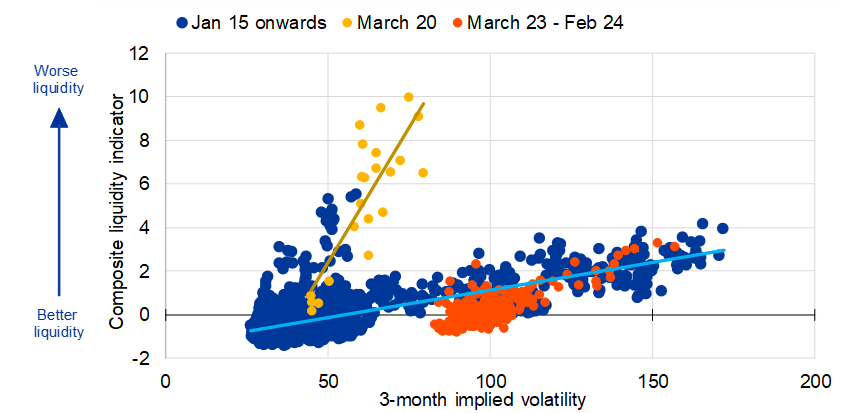
Source: ECB calculations.
Notes: Liquidity conditions proxied by a euro area weighted average composite indicator of liquidity in 10-year government bond markets and implied volatility based on euro-denominated 3-month Swaptions. Higher values of the composite liquidity indicator correspond to worse liquidity conditions. Blue dots indicate observations starting in January 2015. Yellow dots indicate observations from March 2020. Red dots indicate observations from March 2023 to February 2024. The light blue regression line is estimated based on all observations except those from March 2020. The yellow regression is estimated based on March 2020 observations. Last observation: 5 February 2024.
Several factors have supported the smooth functioning of financial markets.
First, the timely communication of the eventual reduction in the Eurosystem’s balance sheet made it easier for market actors, such as banks, insurers, and hedge funds, to plan and adapt. Decreasing the balance sheet in a predictable and gradual manner has supported orderly market conditions.
Second, suppliers of bonds have strategically adjusted their behaviour. Bond issuers – both governments and private companies – reacted to the new environment by initially shortening the maturities of their bonds, and some issued dedicated investment products for retail investors.
Finally, dealer banks have a critical role for secondary markets to remain liquid and efficient. Since the start of the Eurosystem’s balance sheet reduction, they mobilized sufficient space on their balance sheet that smoothly facilitated the buying and selling of bonds between investors in the secondary market.
Did more availability of governments bonds help in repo markets?
The increased availability of euro area government bonds had a positive effect on another crucial market segment: the repo market, where banks lend and borrow from each other against collateral. In 2022, repo market functioning was partly impaired due to the scarcity of high-quality securities that are used as collateral in secured money market trades. This had driven a wedge between repo rates and the ECB’s main policy rate, which contributed to delaying the transmission of monetary policy in the early stages of the tightening cycle.
The improved availability of collateral helped to significantly alleviate such shortages of assets and helped bring repo rates closer in line with our main policy rate. While at the end of 2022 almost 50% of all repo volumes were conducted more than 30 bps below the deposit facility rate (DFR), this share shrank drastically during 2023. Currently more than 50% of all repo volumes are within 10 bps of the DFR (Chart 5).
The overall improvement in repo market functioning has been conducive to the transmission of monetary policy to euro area money markets, as repo market rates have adjusted without delay to policy rate hikes in the later part of the hiking cycle.[3]
Chart 5
Share of euro area repo market trading below the DFR and Eurosystem market footprint (%)
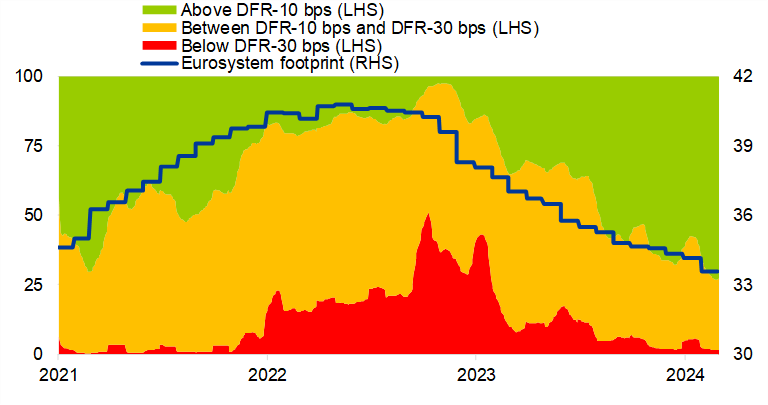
Sources: MMSR, ECB, 20-day averages are displayed.
Notes: The Eurosystem’s footprint in the EGB market is measured as the share of the Eurosystem’s holdings of EGBs compared to the total nominal amount of EGBs outstanding (see chart 1). Specialness of repo market is displayed as share of volumes per rate bucket below the deposit facility rate (DFR). Last observation: 29 February 2024. How to read the figures: At the end of 2022, almost 50% of all repo volumes traded at a spread of more than 30 bps below the DFR. Since then, this scarcity premium has reduced drastically with more than 50% of repo volumes currently trading less than 10 bps below DFR.
Conclusion
The reduction of the Eurosystem balance sheet has taken place in a context of high government bond issuance, requiring private investors to step up their demand in bond markets. Supported by the predictable and gradual reduction of the Eurosystem’s footprint, investors, issuers and intermediaries adapted well to the new conditions, ensuring the smooth functioning of bond markets. Importantly, the increased availability of bonds contributed to improving market functioning in the repo market by alleviating collateral shortages. While the conditions for a continued smooth absorption are in place, market functioning must be monitored closely going forward.
The views expressed in each blog entry are those of the author(s) and do not necessarily represent the views of the European Central Bank and the Eurosystem.
We are grateful to Rita Besugo, Mihail Medvedi and Raúl Novelle Araujo for their contribution to this blog post.
For the asset purchase programme the Eurosystem started to reduce its holdings in March 2023, first by only partly reinvesting redemptions, and as of July 2023 by not reinvesting any redemptions. For the pandemic emergency purchase programme redemptions were fully reinvested in 2023 and until the end of the first half of 2024. The Governing Council announced its intention to reduce the reinvestments in the second half of 2024.
Accordingly, the need to provide bonds back to the market via the Eurosystem’s securities lending facility (especially against cash) has also declined.